这个办法又叫Bootstrap Method。
什么是解鞋带取样?
解鞋带是指从一个样本里面用有放回方法取样,是在同一个样本里面取样,这个名字来源于俗语“pull up by your own bootstraps”,意思就是靠你自己的努力改变自己的境况。解鞋带取样的样本通常是研究者所持有的唯一的样本资源。解靴带取样原理是,其所用的子样本的估计量和样本的估计是相等的。
上图所示就是解靴带取样的原理图,假设你要估计你样本数据的统计精度,你就进行N次解鞋带取样(有时又称解鞋带重复取样),计算每一次解鞋带取样的统计量。这些解鞋带统计量的值被用来估计原始样本的统计量的精度。
解靴带取样方法的假设:
- 你的样本能有效的代表样本
- 解鞋带方法是从样本里面再进行有放回取样,每一次子取样都是独立同分布的,换句话说,它假设子样本和总体的分布相同,但每个样本都是和其他样本独立的。
解靴带取样的应用实例
这里有一些可以用解靴带取样方法解决的典型问题
- 设想你一些样本数据,但是你的样本数量很小,因而你对你样本对应的总体的理论分布不敢确定,你将如何估计四分位距,样本均值的方差。
- 你现在又两个不知道其分布的样本,X,Y。你想知道Z = X/Y的分布,并且得到一些其他有用的统计量(如均值和标准差)。
- 你有样本A,B,想知道它们是不是来自同一个总体。
- 你有一个回归模型
 ,想计算参数αβ的置信区间。
解鞋带取样的数值算例
解靴带取样的核心思想,在本文前面提到,解靴带取样就是一种又放回取样,如何进行呢?假设你仅有五个观测值,你将你的观测值标记为A, B, C, D, E五个小球。

将五个球放进篮子,然后随机取出一个球,记下它的名字,然后再将球放回去,再进行下一次取样,这种取样方法就是有放回取样。这样随机重复取样,记下标签,放回小球,重复进行上千次,这记下的标签就是解靴带样本,很简单,不是么?
你的记录可能会像这样
….., D, E, E, A, B, C, B, A, E etc.
注意,因为你是有放回的取样,解靴带样本重复了一次又一次,这就是解靴带取样的性质。
为什么要解鞋带样本
如果解靴带取样的思想如此简单,为什么我们要进行解鞋带取样
对于一个样本,你只能得到一个统计数据,例如均值,你无法得到均值的分布或者均值的置信区间。解靴带取样能给你均值分布的细节,或者它的均值。下面给出一个在MS excel的计算实例,加强理解。
下载下面的表格先 Download the worksheet example companion of this tutorial here.
假设我们从调研中得到三十个原始样本,我们把他放进好几行,这样能看到他们。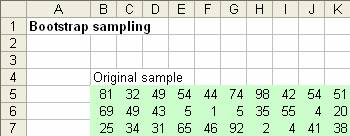
1. 选择原始样本的区域,右键命名单元格区域,设置为sample
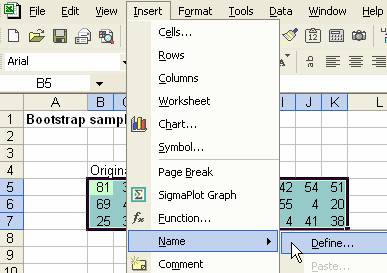
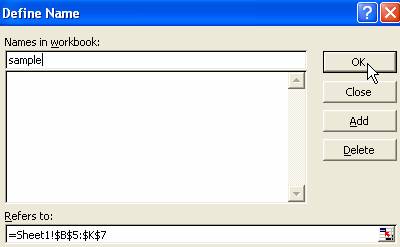
2. 在原始数据下面任意一个单元格,例如B10输入=INDEX(Sample,ROWS(Sample)* RAND ()+1,COLUMNS(Sample)* RAND ()+1) ,这就是在原始样本里面进行了一次有放回的随机抽样,得到了第一个解靴带的样本。
3. 复制到B10:K210 (或者任意多)的区域当中,这样就是得到了那么多的解靴带样本。我们把每一行看成一个独立的样本(这里为了简化,每个样本里面只有十个数据),我们进行了201次抽样。
4. 下一步就是计算解靴带统计量,你能得到任何统计量,例如均值,中位数,四分卫距,标准差等等
=AVERAGE(B10:K10) to compute the mean of one sample
=MEDIAN(B10:K10) to compute median
=QUARTILE(B10:K10,3)-QUARTILE(B10:K10,1) to compute inter quartile range
=STDEV(B10:K10) to compute standard deviation
5. Copy the bootstrap statistics above to all rows of bootstrap samples (i.e. M10:P210)

F9可以对重新计算 F9 is symbol for function F9 is used by MS excel to recalculate iteration.
解靴带的置信区间
计算解靴带统计量的![]() 的置信区间,我们用下面这个公式对统计量进行排序
的置信区间,我们用下面这个公式对统计量进行排序![]()
Using MS Excel, we can use excel function SMALL to sort and get the ![]() value.
value.
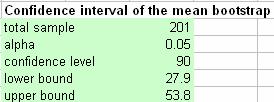
Remember that the sampling distribution is not necessarily Normal distribution. You cannot use ![]() for
for ![]() because the distribution is unknown. Only if you data come from Normal distribution the results of the two formulas will be the same approximately.
because the distribution is unknown. Only if you data come from Normal distribution the results of the two formulas will be the same approximately.
Charting Frequency Distribution
If you would like to see the graph, we can make bin and compute the frequency of the bootstrap statistics. For example, you are interested in the distribution of mean. Since the sample values are in the range of 0 to 100, we can make 10 bins.
Suppose we make the bin values in cell R10:R19 and the bootstrap statistics of mean is in the range of M10:M210.
- Type =Frequency(M10:M21,R10:R19) in cell S10
- While the cursor still in cell S10, select region S10:S19 by highlighting it with mouse
- Press F2, you will see exactly like the figure below
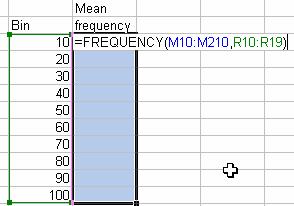
4. Press together CTRL-SHIFT and ENTER and you get all the frequency of the bin.
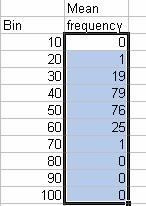
5. Now you can add sum to the frequency and compute relative probability and then graph the bin and the probability
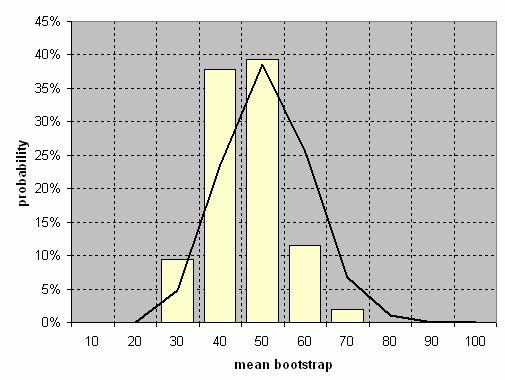
Download the worksheet of this tutorial here
I hope you can see the point here. Only within your sample, you can estimate the statistics. For example, in here, the statistical estimator is sample mean . Using bootstrap sampling, you can do beyond your statistical estimators. You can now get even the distribution of your estimator and the statistics (such as confidence interval, variance) of your estimator.
In contrast to Monte Carlo simulation which you need to know the distribution of the population, in Bootstrap sampling you also create your own data (based on the observation) without knowing the distribution of the population. All you need to know is your sample. Using very simple idea of sampling with replacement, we can make powerful results. Quite amazing, isn't it?
Sampling and Bootstrap Sampling
What is sample and population?
When you measure something and get your data, what you get is called sample from the entire population of your data. For example, you have some questionnaire survey about marketing of a product. You ask many questions especially whether people like to buy this new product. If you can distribute your questionnaire to all citizen of the city, and all of them response to your questions, you get the population. In reality, it is not practical to distribute questionnaire to millions of people. What you can do is take some random sample, say a hundred or a thousand, from the population and assume that your sample is a valid representation of the entire population. From your sample, you can estimate the true value of the population.
What you can get from frequency distribution?
This estimation procedure is called inferential statistics. From your sample, you want to know especially the distribution of the sample. Because your sample is representing the population, the distribution of the sample is also characterizing the population. From the distribution we can get
- Statistics to estimate the properties of sample (and therefore, the population)
- Confidence Interval
- Hypothesis testing
The statistical properties can be any parameters such as summation, central tendency (mean, median, mode) or variation (inter quartile range, variance, range, standard deviation) or some ratio (coefficient of variation, t statistics), etc. Confidence interval represents a range where the statistical properties value will most probably is. For example, you may say that you have confidence that the range of your data will be within 37.5 to 38.5 with small possible degree of error due to random chance. From the distribution, you can also test some hypothesis whether the mean of sample is equal or less than a certain value, or to test whether two samples are taken from the same populations.
Non parametric Bootstrap
The problems happen when you do not know the distribution of the population. If your sample is very small that you cannot even fit the sample into some theoretical distribution, most people simply assume the distribution of the population follows Normal distribution. However, this assumption may not be correct. Can we estimate the distribution from the sample from unknown population distribution?
The answer is yes. Several non parametric tests exist including permutation test, rank (Wilcoxon) test and bootstrap. Using bootstrap method, you have additional benefit. You can even go one step further beyond the estimation of sampling distribution. You can even get distribution of your estimator.
Strength and Weakness of Bootstrap Sampling
- (Negative) Bootstrap method is not exact. For large sample, permutation test perform better than bootstrap.
- (Positive) Bootstrap requires very minimum assumption. Even if permutation test fail, bootstrap method still can do.
- (Positive) Though it can be used for parametric method (i.e. distribution is known), bootstrap method is most useful when the sample distribution is unknown (non-parametric).
Note: Permutation test is similar to bootstrap that it resample from the sample but not randomly. Instead, it considers all possible permutation of the sample.

